pingouin.plot_rm_corr#
- pingouin.plot_rm_corr(data=None, x=None, y=None, subject=None, legend=False, kwargs_facetgrid={'aspect': 1, 'height': 4}, kwargs_line={'ls': 'solid'}, kwargs_scatter={'marker': 'o'})[source]#
Plot a repeated measures correlation.
- Parameters:
- data
pandas.DataFrame Dataframe.
- x, ystring
Name of columns in
datacontaining the two dependent variables.- subjectstring
Name of column in
datacontaining the subject indicator.- legendboolean
If True, add legend to plot. Legend will show all the unique values in
subject.- kwargs_facetgriddict
Optional keyword arguments passed to
seaborn.FacetGrid- kwargs_linedict
Optional keyword arguments passed to
matplotlib.pyplot.plot- kwargs_scatterdict
Optional keyword arguments passed to
matplotlib.pyplot.scatter
- data
- Returns:
- g
seaborn.FacetGrid Seaborn FacetGrid.
- g
See also
Notes
Repeated measures correlation [1] (rmcorr) is a statistical technique for determining the common within-individual association for paired measures assessed on two or more occasions for multiple individuals.
Results have been tested against the rmcorr <https://github.com/cran/rmcorr> R package. Note that this function requires statsmodels.
Missing values are automatically removed from the
data(listwise deletion).References
[1]Bakdash, J.Z., Marusich, L.R., 2017. Repeated Measures Correlation. Front. Psychol. 8, 456. https://doi.org/10.3389/fpsyg.2017.00456
Examples
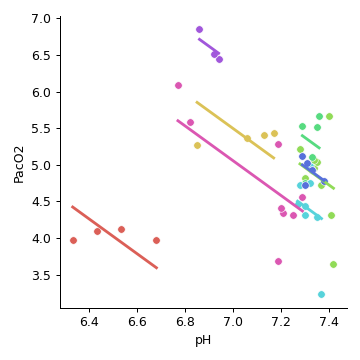
Default repeated mesures correlation plot
>>> import pingouin as pg
>>> df = pg.read_dataset("rm_corr")
>>> g = pg.plot_rm_corr(data=df, x="pH", y="PacO2", subject="Subject")
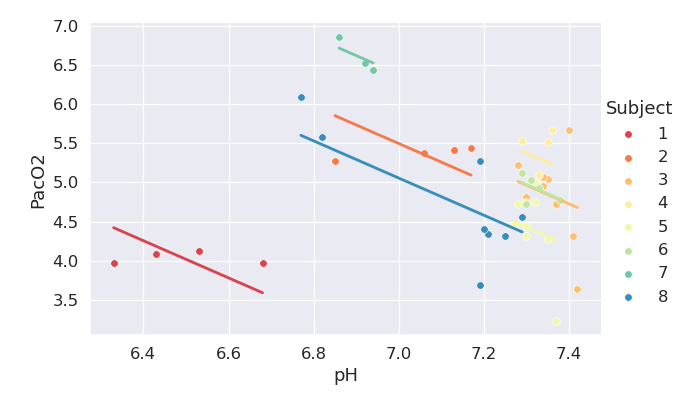
With some tweakings
>>> import pingouin as pg
>>> import seaborn as sns
>>> df = pg.read_dataset("rm_corr")
>>> sns.set_theme(style="darkgrid", font_scale=1.2)
>>> g = pg.plot_rm_corr(
...     data=df,
...     x="pH",
...     y="PacO2",
...     subject="Subject",
...     legend=True,
...     kwargs_facetgrid=dict(height=4.5, aspect=1.5, palette="Spectral"),
... )