pingouin.plot_circmean#
- pingouin.plot_circmean(angles, square=True, ax=None, kwargs_markers={'color': 'tab:blue', 'marker': 'o', 'mfc': 'none', 'ms': 10}, kwargs_arrow={'ec': 'tab:red', 'fc': 'tab:red', 'head_length': 0.1, 'head_width': 0.1, 'width': 0.01})[source]#
Plot the circular mean and vector length of a set of angles on the unit circle.
Added in version 0.3.3.
- Parameters:
- anglesarray or list
Angles (expressed in radians). Only 1D array are supported here.
- square: bool
If True (default), ensure equal aspect ratio between X and Y axes.
- axmatplotlib axes
Axis on which to draw the plot.
- kwargs_markersdict
Optional keywords arguments that are passed to
matplotlib.axes.Axes.plotto control the markers aesthetics.- kwargs_arrowdict
Optional keywords arguments that are passed to
matplotlib.axes.Axes.arrowto control the arrow aesthetics.
- Returns:
- axMatplotlib Axes instance
Returns the Axes object with the plot for further tweaking.
Examples
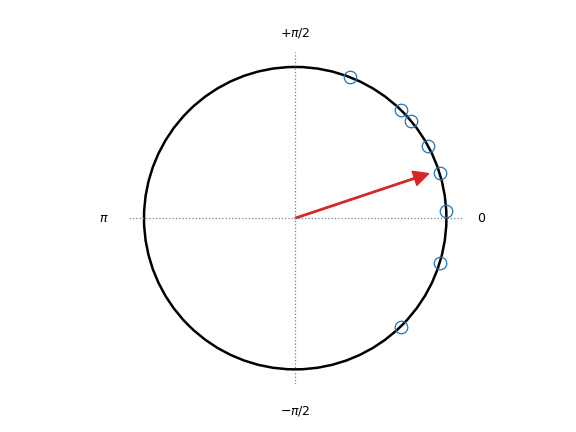
Default plot
>>> import pingouin as pg
>>> ax = pg.plot_circmean([0.05, -0.8, 1.2, 0.8, 0.5, -0.3, 0.3, 0.7])
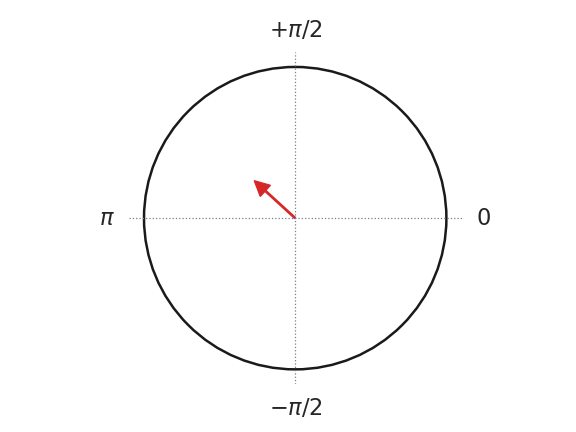
Changing some aesthetics parameters
>>> import pingouin as pg
>>> import matplotlib.pyplot as plt
>>> _, ax = plt.subplots(1, 1, figsize=(3, 3))
>>> ax = pg.plot_circmean(
...     [0.05, -0.8, 1.2, 0.8, 0.5, -0.3, 0.3, 0.7],
...     kwargs_markers=dict(color="k", mfc="k"),
...     kwargs_arrow=dict(ec="k", fc="k"),
...     ax=ax,
... )

>>> import pingouin as pg
>>> import seaborn as sns
>>> sns.set_theme(font_scale=1.5, style="white")
>>> ax = pg.plot_circmean(
...     [0.8, 1.5, 3.14, 5.2, 6.1, 2.8, 2.6, 3.2], kwargs_markers=dict(marker="None")
... )